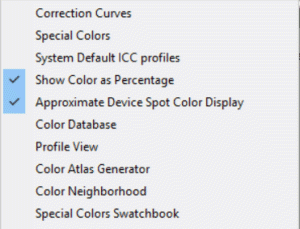
Illustration 1: Selecting Correction Curves
| HOT KEYS (SHORT CUTS) RELATED TO THE COLOR CORRECTIONS WINDOW | |||||||||||||||||||||||||||||||||||||||||||
|
|
||||||||||||||||||||||||||||||||||||||||||

Illustration 1: Selecting Correction Curves
Color correction curves are used to make adjustments to image lightness/darkness and also to specific color channels (hues). It is generally used to "tweak" individual jobs, but can also be used to make adjustments to specific incoming data on the Color Transforms screen. When you make a color correction, you also create a new Imaging Configuration (more below).
Color Correction is performed using the Correction Curves menu shown in Illustration 2. This menu is launched from the main Color menu as shown in Illustration 1. It can also be launched by right-clicking on the job image and selecting it from the pop up menu.
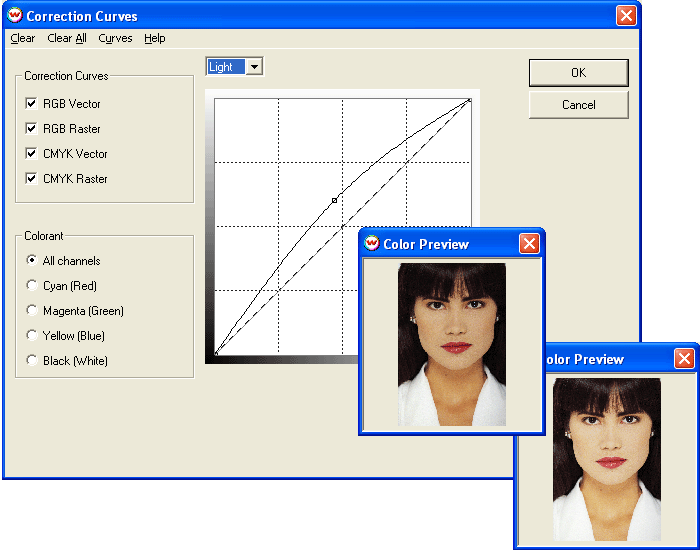
Illustration 2: Lightening an image with Correction Curves
Image Data Type: The Correction Curves area of the menu allows you to select the type of incoming data that will be affected by curves adjustments. When correcting an image, you may select any or all of the four input data categories shown (RGB Vector, RGB Raster, CMYK Vector, CMYK Raster). The changes you make in the curves will be applied to those categories checked.
Colorant (Channel) Selection: The curves editor can be used for two basic functions, as follows.
All Channels: Checking this radio button allows you to lighten or darken the overall image by moving the curve up or down. Illustration 2 shows the results of using all channels to lighten the overall image.
Single Channel: Checking any one of the individual colorant (or color channel) radio buttons means that your curve moves will affect only that channel. This option allows you to make changes specific hues.
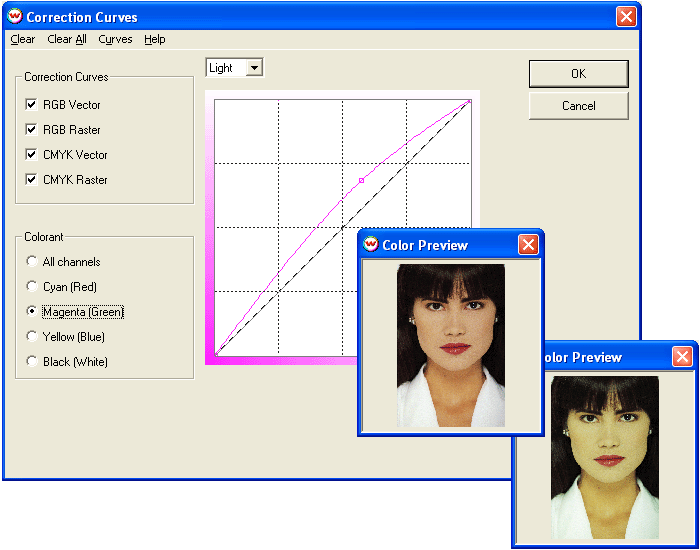
Illustration 3: Correction to the Green colorant channel
EDITING MODEL: When using the curves, you have your choice of curve editing models: Light or Dot %. This model is selected above the curves window on the menu. For the sake of simplicity, the discussion below refers to the Light model. Choosing the Dot % model causes the curves to behave in the opposite way as described below.
The horizontal axis of the interface (left to right) represents Input values, which are the values of the original image as opened in SoftRIP. The vertical axis of the interface (bottom to top) represents Output values, which are the new values you set. Using the Light editing model, the lower left corner of the box is where both Input and Output values are 0% and represents total black. The upper right corner of the box is where both Input and Output values are 100% and represents white (in other words, the "white" of the media when no ink has been printed). The opposite is true when using the Dot % model.
Lower numeric values indicate higher densities and higher numeric values indicate lower densities (Light model). Simply speaking, for all channel corrections using the Light model, lower values mean darkening the image and higher numeric values mean lightening the image. For single channel color corrections, lower values mean increasing the density (amount) of the specific color (channel) selected, and higher values mean decreasing the density of the specific color (channel) selected.
Remember that no action taken in a digital color workflow happens in isolation.
Control points: Prior to editing, the spline curve in the box is a diagonal line running from the bottom left to the upper right of the grid. Control points may be selected at any point along this line and dragged in any direction. You may select as many control points along the curve as you think are useful. Dragging a point up or down lowers or raises output density at that point. The Input and Output values are displayed for the point represented by your current cursor position.
Because the tone range is a continuum, whatever moves you make at one control point affect the shape of the rest of the curve, and consequently, the values at all points along the curve. The advantage of the Curves tool is that you are able to fine-tune a curve shape to affect specific portions of the tone range.
See more examples of how to use the Curves tool further down the page.
Clear: Returns the curve in the window to its linear position.
Clear All: Returns curves for all colorant channels to their linear position.
Curves: Launches a menu of pre-configured curves to achieve common affects (see Illustration 4).
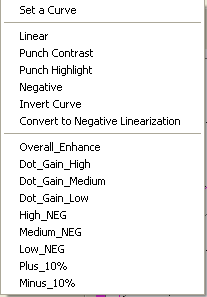
Illustration 4: Commonly used "stock curves"
| Saving Your Color Corrections as new Imaging Configurations: The process of color correction changes the color properties of individual images (jobs) and also specific input data channels on the Color Transforms screen). When you make color corrections using the Correction Curves menu, you will also be creating a new Imaging Configuration that includes your new curves. The new Imaging Configuration can be used with that job or any other job for which that Imaging Configuration is selected. When successful color corrections are made, it is essential that you save a new Imaging Configuration. To save your correction curves, make sure to exit the Correction Curves menu with the OK button. If you use Cancel, your corrections will be lost. When you press OK, the Imaging Configuration - Save As menu shown in Illustration 5 will launch. The name of the current Imaging Configuration is shown in the top window of this menu, while previously generated Imaging Configuration names are shown in the larger window. In the Save As window at the bottom of the menu, enter the new Imaging Configuration name. You must exit this menu by clicking OK to save the new Imaging Configuration name and settings. |
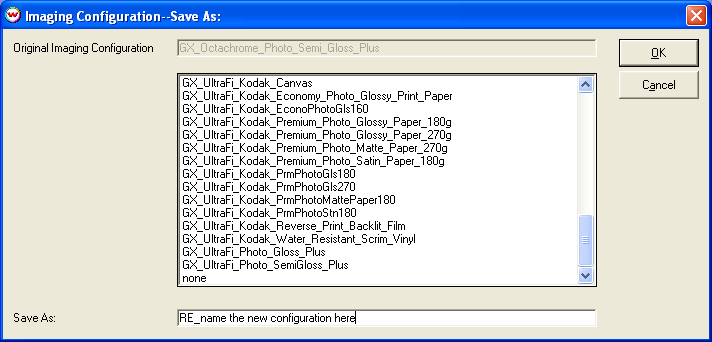
Illustration 5: Saving a new Imaging Configurations under a new name
In general, the Curves tools allow you to control the density (amount) of ink output by the printer at any or all points along the tone range of the image. If you are working in All Channels mode, you are adjusting all of the output channels at the same time. If you are in Single Channel mode, you are adjusting only that color channel.
Here are a few examples of curves:
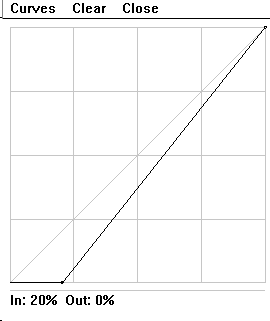
Illustration 6: Darken Shadows
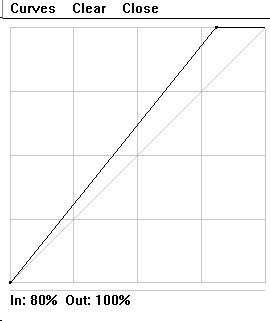
Illustration 7: Lighten Highlights
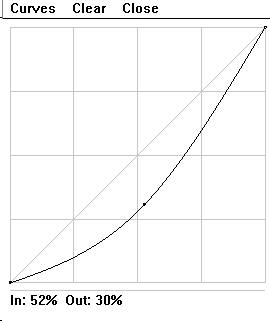
Illustration 8: Darken Midtones
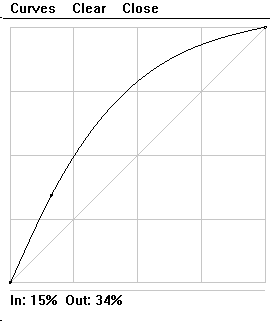
Illustration 9: Lighten Midtones


Illustration 10: Dot gain and dot loss
There are a few very simple things that can be done in a service bureau operation to produce pleasing color for a variety of customers in a quick and cost-effective way. By using these basic "tone-curve" methods in conjunction with appropriate color profiles, you can produce pleasing color from a wide variety of input.
A valuable tip!
If you need to do quite a bit of correcting with these curves, concentrate on getting as close as you can by strictly using the All Channels Correction curve. You'll find that you can get very close indeed and that this is, in fact, the only way you can keep everything straight. Only after you've done this should you make small hue adjustments with the individual color curves.
Here is another valuable tip to keep in mind when you use the color correction curves to adjust hue. If you find that you need to modify one channel a great deal to achieve the desired result, it will probably be better if you modify that one channel less, while modifying each of the other two channels in the opposite direction. This will maximize your hue shift, while minimizing the shift to overall lightness. The interactive color preview on the screen can make this quite clear. It is important to use the Correction curves instead of the Calibration curves for this purpose.
The single most common cause of "muddy" prints is poor selection of the black point and white point in the original scans. With a page containing a scan open on the SoftRIP screen, move your cursor over one of the lightest highlights. The RGB entry on the information window should show at least one number that is over 90%. If not, you are going to see muddy highlights and colors. Move the cursor over one of the darkest shadows. The RGB entry should show at least one number that is under 10%. If not, your prints are likely to have muddy shadows. The same principle applies to CMYK scans.
If you've been given the job of making a nice looking print from a scan with poorly chosen black and white points, there is still something you can do. Make a note of the lowest R, G, or B that you can find in a shadow and of the highest that you can find in a highlight. In a muddy scan, these numbers might be something like 15% and 80%, instead of the 5% and 95% that you would hope to see in a good scan.
Select Correction and All Channels We will use the Lightness editing mode in this example.
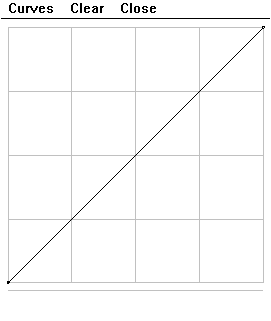
In the Lightness editing mode, black is in the lower left corner at 0 and white is in the upper right corner at 100 for both RGB and CMYK curves. Moving a point upward has a lightening effect for both CMYK and RGB images when using the Lightness editing mode.
Click on the upper right end of the diagonal line and slide it left until the window looks like the following:
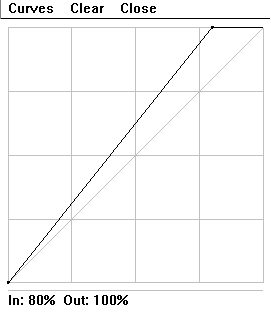
Now your highlights that had only reached 80% in the original will be stretched to reach 100%, or the density of the base media with no ink applied, in the final print. Click on the lower left end of the diagonal line and slide it right until you see this.
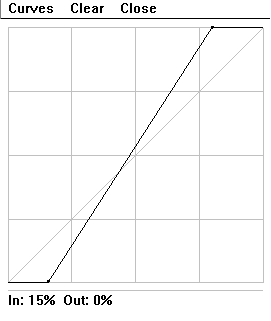
Now you've stretched your shadows from 15% down to 0%, which will cause them to reach all the way to the maximum density available with the media and ink that you are using.
Perhaps you've done this, and your shadows are now nice and dark and your highlights are nice and bright, but the overall density of the picture, of the midtones, is too dark. Click on a point in the center of the diagonal line and slide it upward until it looks something like this:
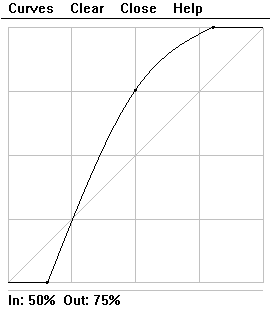
You've now lightened the 50% midtone by 25% to 75%, while leaving the highlights and shadows where you set them earlier. This is the most common kind of tone correction needed for faulty scans.
The Special Colors menu provides controls for managing spot colors and access to the Color Database.